| Cari Google |
|
|
| Berita & analisis |
|
| Forum Forex |
| |
Blog Forex |
| |
| Personal pages |
| |
| EU Forex Predictions: |
|
|
|

| Wednesday, May 31, 2006 |
| Pengenalan kepada FOREX |
Forex(Dagangan matawang asing ).
Forex ,nama singkatan popular Foreign Exchange adalah satu lagi bentuk sumber wang yang popular dikalangan pelabur mahupun usahawan internet.Ia membolehkan kita memperdagangkan matawang asing dengan mudah .Jika sebelum ini hanya bank-bank besar dan orang yang kaya didunia sahaja buleh membuat forex trading,tetapi kini sesiape saja yang mempunyai internet dan PC dirumah mampu untuk menceburkan diri dalam Forex (secara internet trading).Akibat dari pada saingan broker forex di internet,kini dengan bermodalkan usd1 sahaja pun anda sudah buleh memulakan dagangan forex.Malah sudah ade platform broker internet forex yang menawarkan modal pendahuluan apabila anda menyertai program mereka.
Market bagi Forex Trading pada masa kini mencecah nilai 1.4Trillion USD sehari.Ianya 46 kali lebih besar daripada gabungan semua market pada masa depan.Ini membuktikan Forex trading adalah pasaran dagangan yang paling besar asetnya di dunia pada masa kini.
Kini sudah ada program-program yang menawarkan sistem kawalan dagangan Forex yang baik dan terancang.Gabungan program yang baik,'skill' dan pegalaman seseorang pedagang Forex dalam menganalisa market secara fundamental ataupun secara teknikal, dengan mudah mereka dapat mengaut keuntungan yang banyak disamping dapat meminima kan risiko kerugian.
Anda buleh lihat contoh website forex di :
TOP 100 FOREX SITES
Forex intro in English : -
What is forex?
Forex (Foreign Exchange) is the name given to the "direct access" trading of foreign currencies. With an average daily volume of $1.4 trillion, forex is 46 times larger than all the futures markets combined and, for that reason, is the world's most liquid market. In the past, forex trading was limited largely to enormous money center banks and other institutional traders. But in just the past few years, technological innovations and the development of online trading platforms, such as that used by dt FX, allow small traders to take advantage of the significant benefits of trading foreign currencies with forex.
Foreign Currency Exchange (Forex) Trading allows an investor to participate in profitable fluctuations of world currencies. Forex trading works by selecting pairs of currencies and then measuring profit or loss by the fluctuations of one one currency's market activity compared to the other. For example, fluctuations in the value of the $ U.S. Dollar are measured against another world currency such as the £ British Pound, € Eurodollar, ¥ Japanese Yen etc. Being able to discern price trends in market activity is the essence of all profitable trading and this is what makes foreign currencies so exciting, currencies are the world's 'best trending' market. This gives Forex investors a profit making edge that is unavailable in most other markets.
Forex Trading is being called 'today's exciting new investment opportunity for the savvy investor'. The reason is that the Forex Trading Market only began to emerge in 1978, when worldwide currencies were allowed to 'float' according to supply and demand, 7 years after the Gold Standard was abandoned. Up until 1995 Forex Trading was only available to banks and large multinational corporations but today, thanks to the proliferation of the computer and a new era of internet-based communication technologies, this highly profitable market is open to everyone. The Forex Trading Market's growth has been unprecedented, explosive, and continues to be unequaled by any other trading market
Simply stated, Forex is the most profitable because it is the world's largest marketplace. The Foreign Currency market as a whole accounts for over 1.2 trillion dollars of trading per day (as determined by the fourth Central Bank Survey of Foreign Exchange and Derivatives Market Activity, 1998. This figure is understood to be significantly higher today). To put this into perspective, on any given day the Foreign Currency Exchange Market activity is vastly greater than the Stock Market. It is 75 times greater than the New York Stock Exchange where the average total daily value (using 1998 figures) of both foreign and domestic stocks is $16 billion, and much greater than the daily activity on the London Stock Exchange, with $11 billion |
| posted by Free Egold @ 11:47 AM |
|
|
|
|
| Marketiva Forex Platform |

Marketiva adalah platfom dagangan forex yang mudah & senang dikendalikan,sesuai bagi mereka yang baru menjinakkan diri dalam dunia forex.
Malah anda akan diberi $5usd percuma apabila mendaftar dengan mrketiva.
Anda juga buleh memulakan jualbeli sebenar dari serendah $1usd,tidak seperti platfom lain yang sekurang-kurangnya anda kene ade $100usd atau lebih.
Marketiva Intro in English :-
Start Trading Forex With as Little as $1 at Marketiva
If you ever thought about Forex Trading then a great place to learn is right here at Marketiva plus they pay you $5.00 real money just to open your account and another $10.000 virtual money to practice with.The spot foreign exchange trading is the largest market in the world.It involes the buying and selling of one country's currency in terms of another. Investing in this highly lucrative market gives investors the opportunity to earn profits in just a matter of minutes.
Marketiva is a Swiss company based in Lausanne and have recently launched their Forex Trading Platform fully intergrated with e-currencys {Ebullion E-gold}It is a state of the art platform with many advanced features but really user friendly for beginners with 24 hour live support via their onboard chat room Spend some time on the website and you just might surprise yourself by how much you learn and in six months or a year from now you could be trading for a living.
Did you know that Chrysler Corporation made more money last year from Forex Trading than car production. Please take note if you join at the weekend the Markets close at 5pm EST 10pm GMT on Fridays and live trading live chat and live support are closed until 5pm EST or 10pm GMT Sunday.You can still contact support through their email system on the website if you have any questions. Joining Marketiva is a 2 step process first fill out the application form to join and then you need to download Streamster from the Marketiva website to gain acess to their trading platform and live chat.
Klik Sini Untuk Mendaftar dengan Marketiva :-
http://www.marketiva.com/?gid=3526
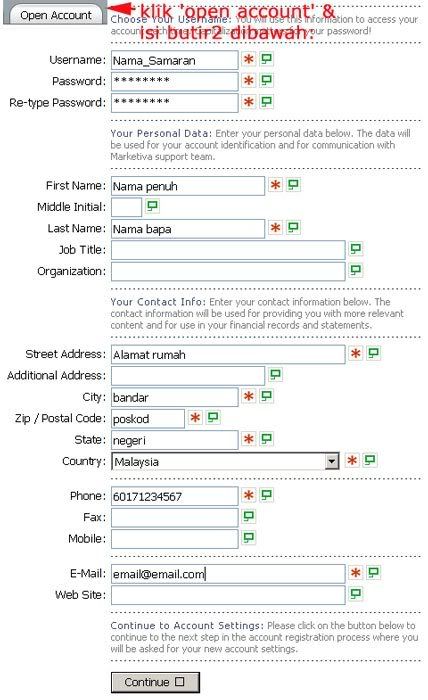
Klik Tab 'Open Account' dan isikan borang pendaftaran dengan maklumat lengkap anda :-
Buleh guna kupon-kupon ni semasa mendaftar marketiva :
"SU1MGCGQOK, D77RIPPZGM, IGUKCFWCEO, BBM8Y19G5A, BRGW9I076G, Z6QEVJM5PX,
NXG7XW3NKZ, V4EKUJC6AX, FW3LBXET0Z, AR0JZSI2KC, O1BHQ6Q214, HEQ6OA3JUQ,
FM05DK0CPQ, SP6BRNL781,62WYWIAMAX, F9YAZ3WRVV, RJ0E3G7COM, OE4BWHZBHG"
Setelah mendaftar,anda buleh buka email anda sebagai pengesahan yang marketiva telah menerima pendaftaran anda.
Adalah sebaik-baiknya anda terus membuat proses verifikasi bagi mengelakkan akaun anda dibekukan.
Cara nya ialah dengan klik disini : https://www.marketiva.com/index.ncre?page=identification
dan upload dua dokumen pengesahan diri anda : 1= salinan kad pengenalan ,2=bill utiliti yg tertera nama dan alamat anda semasa anda mendaftar marketiva.
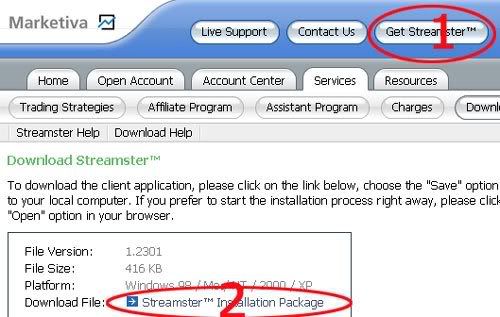
Seterusnya kita muat turun 'marketiva streamer',iaitu satu program yang dapat menunjukkan carta matawang forex & maklumat akaun anda secara live.
anda buleh muaturun nya disini : http://www.marketiva.com/_getclient.ncre?name=streamster&version=latest
atau klik pada 'get streamer' > 'Download' :
'Install' dan 'login' 'marketiva streamer' menggunakan nama samaran & password yang anda guna semasa mendaftar.
Sedikit pengenalan antara muka marketiva streamer :-
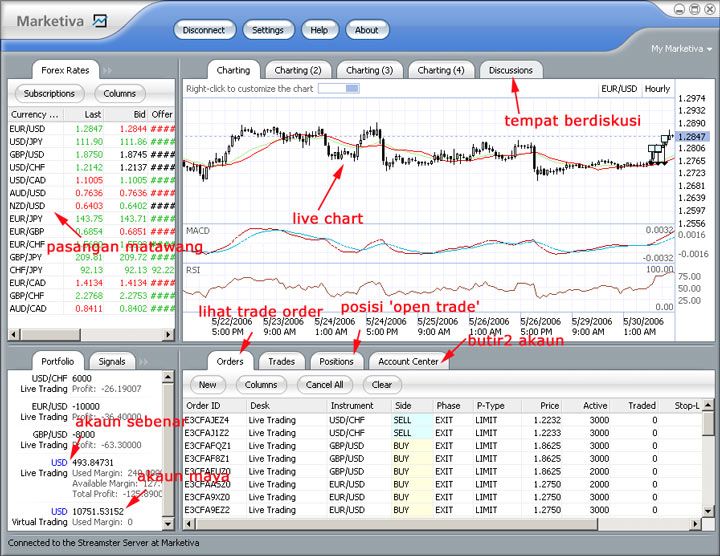 Sebagai permulaan anda diberi $5 usd percuma kedalam akaun sebenar anda(live account) & sebanyak $10,000usd diberi sebagai akaun maya(virtual account). Sebagai permulaan anda diberi $5 usd percuma kedalam akaun sebenar anda(live account) & sebanyak $10,000usd diberi sebagai akaun maya(virtual account).
Anda buleh menambah nilai akaun sebenar anda dengan membuat deposit melalui 'wire transfer' ,e-gold ataupun e-bullion.
Kini anda buleh terus membuat 'order' belian(buy) atau jualan(sell) menggunakan nilai yang ada didalam akaun anda.Adalah dinasihatkan kepada pengguna baru agar membiasenya diri berdagang di marketiva menggunakan akaun maya.Sehingga anda sudah yakin barulah beralih ke akaun sebenar.
Untuk membuar 'order' belian atau jualan,anda hanya perlu klik pada pasangan matawang yang ingin anda 'main' ,satu tetingkap baru akan keluar dimana anda buleh meletakkan jenis order,kadar sasaran,had kerugian ataupun kuantiti dagangan anda :
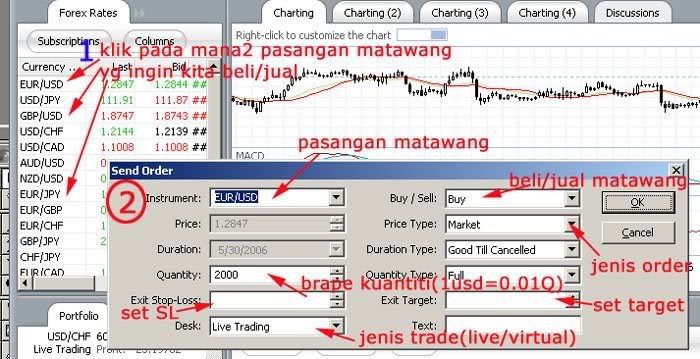
Ini adalah perkara asas dalam Marketiva platform.anda juga buleh mendapatkan live support pada 'discussion board' di marketiva streamer.Ada juga channel Malaysia dimana anda buleh berborak & bincang berkenaan forex. |
| posted by Free Egold @ 11:46 AM |
|
|
|
|
| Apa Itu E-gold ? |
 Apa itu 'E-gold'. Apa itu 'E-gold'.
E-Gold ialah matawang elektronik (e-currency) yang dikeluarkan oleh e-Gold Ltd. yang nilainya disandarkan kepada harga emas semasa dalam US$ atau mata wang yang lain. Unit e-Gold ini boleh digunakan untuk membeli atau membuat pembayaran kepada barangan atau produk dari syarikat yang bersedia menerima e-gold sebagai pembayaran.
Setelah buka akaun e-Gold, unit e-Gold boleh ditambah/dibeli atau dijual semula melalui agent/syarikat jaul-beli e-Gold, lihat senarai dalam laman web e-Gold pada menu e-Gold Directory. Terdapat banyak agen yang menjalankan bisnes ini dengan memberikan kemudahan dan mengenakan komisen.
E-gold Introduction in English : -
E-gold was established in 1996. It is an electronic currency which is backed ounce for ounce by actual gold bullion. It is not connected to the banking system in any way. E-gold.com themselves cannot convert cash into gold or visa versa. Instead there and dozens of independent exchange services who will change your cash into gold or your gold into cash. We refer to these services as gold brokers.
Advantages:
Anyone can open a free e-gold account with no restrictions (Geographic, age, status etc.).
You can have more than one e-gold account.
It takes 5 minutes to open your account and another 5 minutes to set up a single item shopping cart.
You can fund your account with a credit card, debit card, bank wire, bank draft, cash, electronic banking, Western Union, etc. etc. - the options are growing all the time.
Transferring money from account to account is easy, secure and almost instant.
To all intents and purposes an e-gold account is an instant offshore account.
There is no such thing as a chargeback - once money has been transferred to your account that's it.
Spending e-gold is free. Vendor transaction fees are very very low compared to credit card fees. It is only 1% subject to a maximum of 50 cents (USD) per transaction. There is an annual Agio fee of 1% on your average monthly balance. This is deducted in monthly installments.
Overall it is a great way to anonymously pass money from one individual to another individual / organisation.
Redeeming your e-gold is easy. You just get a cheque (check) posted to whatever name you want at whatever address you want. Have it transferred straight in to your UK account at no cost. You can also cash in your e-gold with various anonymous ATM cards.
Disadvantages:
The only drawback with e-gold is that funding your e-gold account not instant. The first time you fund your account with a credit card there will be a delay while your card is verified. This could be anything from a few hours to a day and might only involve a phone call to you. The next time will be much quicker as your credit card would be verified.
Only some gold brokers will accept personal cheques (checks) and credit cards.
The fee charged for using a credit card can seem to be quite high. Goldex charge 10% which is the best rate we have found. The discount offered by some vendors for using e-gold usually cover the charge.
Funding your account anonymously can take anything from a day to 2 weeks depending on the method you use. Just go to any bank and hand over your cash. You can then have it wired to your gold broker or post a bank draft to them. This is also the cheapest way to fund your account
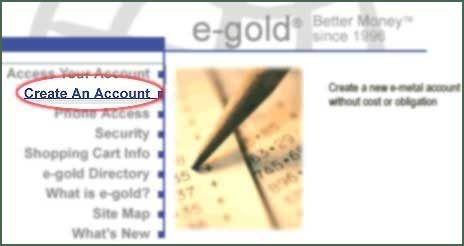
Open an E-gold account :
Anda buleh Buka akaun e-gold disini :-
https://www.e-gold.com/newacct/newaccount.asp?cid=2925602
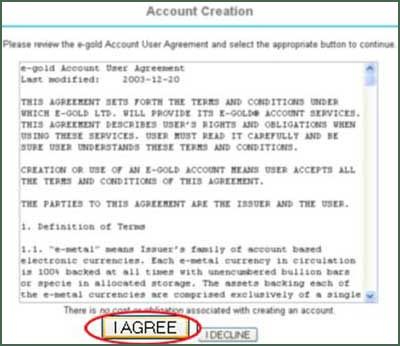
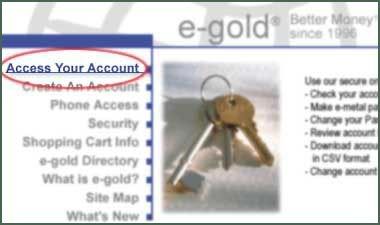
Apabila anda sudah memasuki lamanweb e-gold,anda buleh ikut langkah dibawah untuk bantuan pendaftran :-
1. Pertama klik > Create an account > I Agree
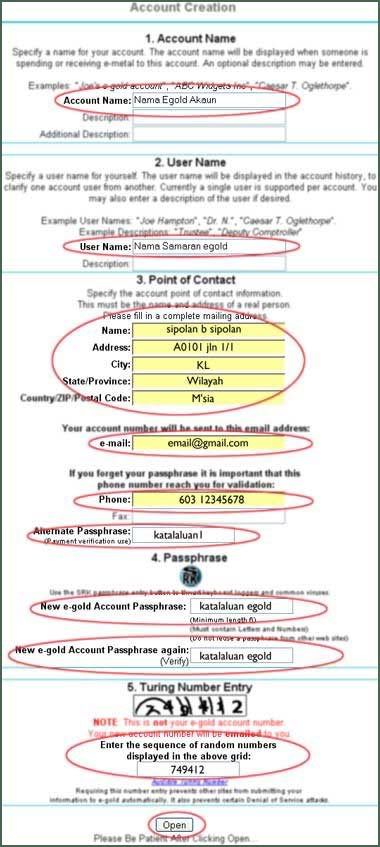
2. Isi seluruh informasi yang diperlukan oleh pihak E-Gold.com
Passphrase atau password gabungan huruf dan angka , cara membuat pharaprase yg benar seperti ini : 1234bikinegold, surabaya1234 , atau anda pilih password dengan mencampur angka dan huruf.
Pilih nama e-gold account anda dengan benar, misalnya : Siti Egold, Idol Egold, My Egold dsb terserah anda.
3. Check semua data > lalu klik submit / enter.
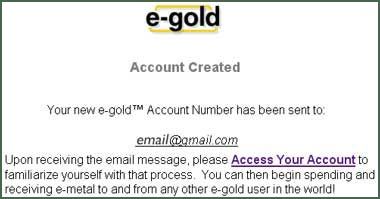
4. Nomor ID E-Gold anda akan dikirim ke e-mail anda otomatis.
5. Buka email anda 2 menit kemudian, baca email dari pihak E-Gold Company dan catat nomor ID E-Gold anda tersebut, selalu ingat No Account e-gold dan rahasiakan password anda.

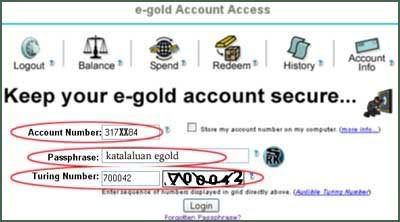
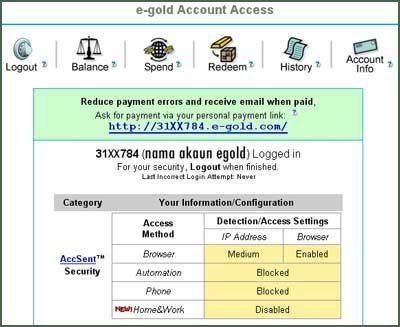
Menu apa yang tersedia di e-gold ?
Menu yang disediakan adalah sbb.:
Balance = untuk melihat baki wang dana anda.
Spend = untuk hantar/bayar egold ke akaun e-Gold lain.
History = untuk melihat perincian transaksi lepas
Account Info = untuk merubah profile dan passphrase/password.
Pastikan selalu logout untuk keselamatan account anda.
Bagai mana hendak mengisi akaun egold anda?
Ada banyak cara sebenarnya,tetapi antaranya anda buleh membeli dari mereka yang sudah membeli egold.Kebanyakan rakan Malaysia menjalankan jual/beli egold melalui YM(yahoo massenger) .Bagaimana mereka mengetahu sapa yg ingin beli/jual?
Ade beberapa website/forum tempatan yang menyediakan tempat jual/beli egold.
Antaranya ialah www.nogold.com ,jomklik.com,carigold.com,zelzemgold.com,rmgold.com dan lain lagi.Tetapi Awas!kerana jika anda tidak mengenali penjual/pembeli memang ade risiko penipuan.Tidak dinafikan ade kes-kes penipuan dlm dagangan egold.Maka adalah lebih baik anda menjual/beli dari rakan yang anda kenali.
Ada juga website yang menawarkan pembelian egold melalui kad kredit.tapi saya cadangkan https://asianpay.com/index.php?ref=8889 Tetapi biasenya jika menggunakan kad kredit cas yg dikenekan adalah tinggi sedikit.
Bagai mana hendak menukar kembali egold kepada Ringgit Malaysia?
Lakukan perkara yang sama semasa anda membeli.Iklankan di website jual beli dan tinggalkan nombor kontek anda supaya pembeli dapat menghubungi anda.Adalah lebih baik sekiranya jual beli dilakukan secara 'cash on delivery',bermakna dua-dua pembeli dan penjual melakukan jual beli secara cash (by hand).
Satu lagi cara ialah melalui debit card.Anda buleh memperolehi debitcard egold dari asianpay juga.Melalui debitcard ini anda buleh mengeluarkan terus egold anda dari mana-mana ATM mesin yang mempunyai logo cirrus /+(plus). |
| posted by Free Egold @ 11:45 AM |
|
|
|
|
| Bunnygirl cross (BGX) Method |
Bunnygirl cross(BGX).
Asas2 setup utk pendekatan BunnyGirl Cross:-
1)pasangan matawang yg disarankan :- EU,GU,UC,EJ
2)masa trading :- Sesi euro , sesi us & *pembukaan harian(00:00gmt).
3)setting chart :-
i)30M utk lihat persilngan
ii)5M utk anggar masa kluar(exiting)
iii)1D utk lihat trend market.
4)Indicator yg digunakan :-
i)wma5
ii)wma20
iii)wma100
iv)RSI
5)Peraturan2:-
5A)Ambil order Belian(Long) bila :-
i)wma5 bersilang keatas wma20
ii)wma5 & wma20 diatas wma100
iii)RSI 'divergence' diatas 50
5B)Ambik order Jualan(short) bila :-
i)wma5 bersilang kebawah wma20
ii)wma5 dan wma20 dibawah wm100
iii)RSI 'divergence' dibawah 50
Di sini ada ebook yg bagus untuk pembacaan bunnygirl cross(BGx) sistem :-
Klik sini utk dload BGX ebook
dan ni template Bgx yg asal buleh cari & dload kat sini :-
klik sini utk download indicator & template BGX
sbgi cth ,ni sy ade setup graf utk sistem bunnygirlx :-
 |
| posted by Free Egold @ 11:45 AM |
|
|
|
|
| Simple Combined Breakout System for EUR/USD and GBP/USD by hans123(SBFx) |
Simple Combined Breakout System for EUR/USD and GBP/USD
* Determine the 06.00 CET – 10.00 CET High Low on EUR/USD and GBP/USD
* Determine the 10.00 CET – 14.00 CET High Low on EUR/USD and GBP/USD
* Set BuyStop at High + 5 pips and SellStop at Low - 5 pips for both timeframes and both currencies
* Set Target Price at entry + 80 pips for EUR/USD and entry + 120 pips for GBP/USD
* Set StopLoss at entry - 50 pips for EUR/USD and entry - 70 pips for GBP/USD. If the other side of the breakout is within 50 pips for EUR/USD or within 70 pips for GBP/USD then the StopLoss will be that level (Longtrade: SL = Low range - 5 pips = SellStop; Shorttrade: SL = High range + 5 pips = BuyStop)
* Move the SL to breakeven after a gain of 30 pips for EUR/USD and a gain of 40 pips for GBP/USD
* If a certain position is taken and price turns agains you and it breaks the other side of the breakout channel then turn. If the breakout channel is broader then the stoploss first the stoploss will be hit. If the breakout channel is narrower then the stoploss then hitting the other side means that you have to turn your position. There is only one turn per time frame possible
* At 24.00 CET all orders expiring and close all trades at market. On Friday we do the same at 23.00 CET.
This link displays the time in every major city in the world: www.qlock.com. I am using CET time (Amsterdam, Frankfurt).
Results October 2005:
10/03 : -22 pips
10/04: -61 pips
10/05: -103 pips
10/06: +168 pips
10/07: +156 pips
10/10: +135 pips
10/11: +61 pips
10/12: +108 pips
10/13: +97 pips
10/14: +274 pips
10/17: +178 pips
Total: +991 pips
The results this month are extreme. In general the system gives you an average return of 600 pips a month from March 2005.
On monthly basis the results are:
March 2005: +721 pips
April 2005: +940 pips
May 2005: +296 pips
June 2005: +857 pips
July 2005: +1,352 pips
August 2005: + 35 pips
September 2005: -20 pips
October 2005: +1,825 pips
November 2005: +554 pips
December 2005: +345 pips
January 2006: +73 pips
February 2006: -13 pips
March 2006: +633 pips
April 2006: +617 pips
All calculations before October 2005 are done by hand, so it is possible that there is a small deviation. It is only to show the power of such a simple system. Maybe someone can program this for Metatrader 4
http://www.strategybuilderfx.com/forums/showthread.php?t=15439&highlight=MT4+pivot |
| posted by Free Egold @ 11:44 AM |
|
|
|
|
| BrunoFX 's observations of the Nina method. |
BrunoFX Observations of the Nina method. : http://www.forex-tsd.com/suggestions-trading-systems/803-observations-nina-method.html
guiding principle:
crossing ind+ma25 above or below the reference mark 0. confirmation of the stoch + confirmation fx_fisher
Rules:
FT: M30
Indicators: IND Inverse +MA50
FX_Fisher
Stoch (5.3.3)
Buy: cross INDinverse+EMA50 (no reference mark) Stoch green line with the top of the red line and it must go up + Fx_fisher :it bar must be green and above reference mark 0
To close the order: with the crossing of the line of Stoch or TP = 15 or 20
Sell: inverse
For the sell, to see the reverse and the same for to close order
you must have the 3 indicators to validate the order at the same time
_______________________________________________________
BrunoFX... i m impressed by the simplicity of this system. As far as my experience is concerned, the real success in the forex market lies in applying simple trading systems with discipline and consistency. However, a very important part, ie the exit, is still need to be developed.
The problem with exits of trend-following systems is that not all exit strategies work well in different market conditions. An exit strategy which may hve earned u most of trend two or three times, will probably let u out too early the third or fourth time. So basically the point I am trying to clear is we must get settle on anyone way to exit which we are comfortable with. I use many exit strategies, some of which are detailed below...
ATR Exits
I use this one to take a fix no. of pips. Here, I take the value of ATR(14) on the bar/candle I entered my trade and multiply that value by 2,3,4 or 5 depending on the momentum in the market. The resulting value is the no. of pips I take. For e.g. today on GBPUSD, a trade was signaled at 06:30 GMT. The ATR(14) at the time of entry was 0.0014. Multiplying it by 5 gives me 0.0070 or 70 pips. So this becomes my profit target.
BrainTrend2Stop
I often use this indicator for trailing my stop. I think this needs no further explaination. Most of the time i get very good exits.
Pivots Based Exits
Using a combination of Camarilla Pivots and standard pivots can be a very effective way of exiting a trade. This method helps u to catch most of the pips but it requires a little judgement. Once u practice this way of exit, believe me, u wont need another.
Hope this helps everyone. If anybody wants, I can post chart examples. |
| posted by Free Egold @ 11:43 AM |
|
|
|
|
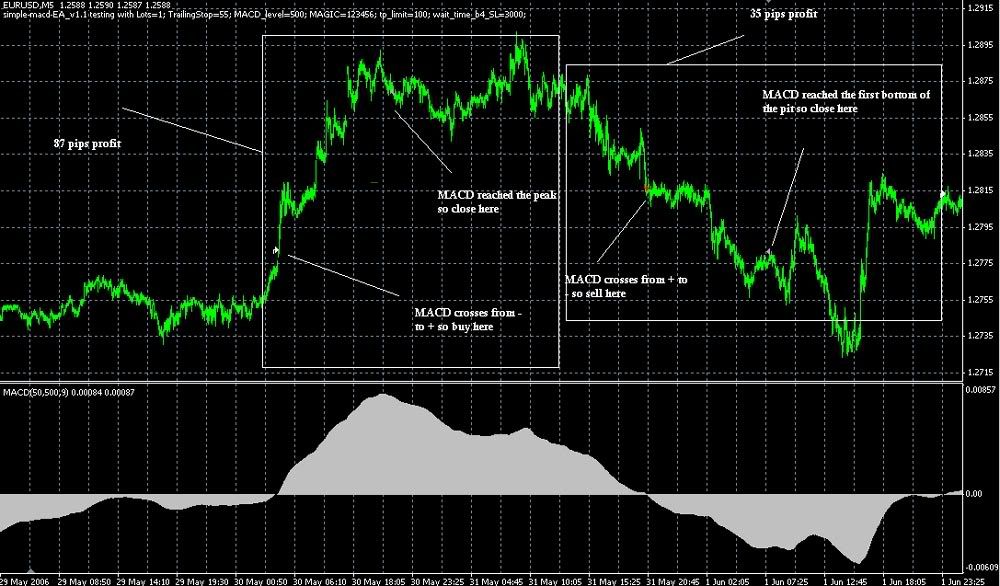
| EA "SIMPLE-MACD" & "SPOUTNIK REBIRTH" |
Rase ni antara EA yg mempunyai backtest performance yg baik,
tapi fwd test blum ade lagi tunjukkan camna dia perfrom.
selame ni pun ade usha EA dari forex-tsd kat elite section...so far result dari fwd test EA kat sana blum ade yg betul2 bleh bagi P/L ratio yg baik & konsisten.tp just tengok2 so mmg tak blajar lagi camna nak set EA.
EA ni pulak mmg blum ade lagi fwd test result coz baru je kelmarin dia post,
sebelum ni dia pun ade buat EA menggunakan konsep fibo,tapi backtest menunjukkan EA simple_MACD ni lebih baik.
Sistem dia mudah je..just juna MACD sebagai indi,
rules dia :-
1) Bila nilai MACD bertukar dari - to +, order buy
2) Bila nilai MACD bertukar dari + to -, order sell
3) Tutup position bila MACD mencapai puncak tertinggi/terendah yg pertama.
4) Sekiranya position yg kita bukak tak profit,tutup terus dengan kadar loss terendah(setting SL).
buat mase ni diorang kat forexfactory tengan cari seting paramiter yg terbaik utk EA ni..
rekomendasi Timeframe tuk EA ni =1M atau 5M.
kat cni ade ebook cite pasal basic EA : http://planet.time.net.my/CommerceSquare/durianruntuh/MT4_EA_guide.pdf
jom kita maju setapak lagi dgn bincang pasal EA plak.. :)
-------------
source :
forexfactory : http://www.forexfactory.com/forexforum/showthread.php?t=6120
contoh chart 'simple_mACD' : http://i62.photobucket.com/albums/h101/jomforex/simplemacd.jpg
______________________________________________________________________
2) EXPERT ADIVSOR SPOUTNIK REBIRTH H1-V1.1
Thanks for your help !
I understood problematic linked to the fisher…
Therefore i added CCI in 35 (thanks to "trader79")
BBsqueeze i know this indicator but i prefer for the EA development to use standard indicators (For "Dirk")
The new tpl below – i replaced Fisher by CCI Woodies in 35...
--------------------------------------------------------------------------------------------------------
EXPERT ADIVSOR SPOUTNIK REBIRTH H1-V1.1
Dear All
Just below a method i developped giving goods results
I would appreciate if we could create a team as follow :
1) EA programmer on MT4
2) Tester on on different broker
TimeFrame : H1
Currency : All
Indicators used : TrendCCI 35 + Flat trend H1 + macd 8.12.1
MA CrossOver Signal 5-7
Working hours : euros, chf, gbp : 7 -12'00 GMT time and 15'00 till 18'00 GMT TIME
Working hours : yen : 01.00 AM -15'00 GMT time
Rules Long positions :
Correlation of 4 indicators :
Between Zero line of MACD 8.12.1 with Trend CCI 35 which should go above zero
+ Green bar on Flat Trend and Arrow Green on MA Crossover Signal (Cross EMA 5 - 7)
SL :50
TP : open
trailing stop: 50
Exit with All Conditions Short (On Four Indicators)
Rules short position :
Correlation of 4 indicators :
MACD 8.12.1 Cross Below Zero line with Trend CCI 35 cross Below Line zero
+ Red bar on Flat Trend and Arrow Red on MA Crossover Signal (Cross EMA 5 - 7)
SL :50
TP : open
trailing stop: 50
Exit with All Conditions Long (On Four Indicators)
EXPERT ADIVSOR SPOUTNIK REBIRTH H1-V1.1 -tech data in order to developp an expert advisor (EA)
Lots : 1
Maximum lots : 2
TP : 50
SL : 30
TS : 30
Money management
Start hour H1
End hour H1
Start hour H2
End hour H2
Enclosed : gif + tpl + indicators pack
http://www.forex-tsd.com/20000-post16.html |
| posted by Free Egold @ 11:40 AM |
|
|
|
| Wednesday, May 24, 2006 |
| STRATOBLASTER FOREX TRADING FORMULA |
ITS HERE NOW!
Originally from THE TUNNEL METHOD, I am switching to a NEW THREAD FOR 2006! STRATOBLASTER FOREX TRADING FORMULA
This new thread will address issues of the OLDER FORMULA and what I HAVE ADDED so please stay tunned until fully completed.
In the mean time I will post charts to look at and if any one out there is interested in this new thread, I SUGGEST YOU GO FIRST TO THE TUNNEL METHOD AT
http://www.strategybuilderfx.com/for...771#post141771
and read the posts and look at the charts so you get a good feel of the original Strato Tunnel Formula!
EVERYBODY WELCOME IF YOUR NICE AND POLITE ONLY! ABSOLUTELY NO NEGATIVE POSTS WHAT SO EVER!!
Welcome,
Strato
YOU WILL NEED TO DOWNLOAD THE SBFX PLATFORM to MAKE SURE you on the same page with all of us at:
http://www.strategybuilderfx.com/platform.php/
UPDATE: NEW ZIP FILES ATTACHED FOR INDICATORS!ATTACHED HERE ARE BASIC RULES OF NEW FORMULA !
ALSO, SO YOU HAVE AN IDEA OF WHERE I AM COMMING FROM PLEASE PRINT AND STUDY THIS:
LEARNING TO DAYTRADE FOREX IS A PROCESS WHICH REQUIRES diligent study of CHARTS, PATTERNS, PRICE ACTION, CANDLE FORMATION, TRADING ZONES, Learning the PROPRER SETUPS for a trade, and most importantly WHEN NOT TO ENTER A TRADE!
THIS MUST BE PRACTICED AND MASTERED ON DEMO FOR A FEW MONTHS, FOR it is NOT a GET RICH QUICK SCHEME whatsoever!
If you willing to put in the TIME AND BLOOD, SWEAT AND TEARS, to Learn trading this FORMULA, YOU WILL MAKE MONEY! Please just DO NOT EXPECT to be SPOON FED, becuase you will NEVER LEARN that way! YOU MUST PRACTICE AND TREAT THIS LIKE A BUISNESS!
I am here to COACH YOU, not TRADE FOR YOU! It is your job to learn these setups so YOU CAN PULL THE TRIGGER! It is YOUR MONEY!
I post CHARTS all the time SHOWING YOU what to look for to MAKE A PROFITABLE TRADE, AND IN THIS FORMULA WE DO NOT GAMBLE! YOU MUST BE PATIENT AND WAIT FOR THE RIGHT SETUPS and ENTRY'S, AND ALSO LEARN THE PROPER EXITS!!!!
It is my feeling that if you want to JUMP AROUND all these threads, it is impossible to be proficient in DAY TRADING FOREX. You need a set of RULES, and you must stick by those rules to give you any kind of chance of making money. 90% of RETAIL TRADERS in FOREX lose money, for lack of DECIPLINE! So whatever RULES OR METHODS you want to follow, either this one or another one out there, just stick to ONE GAME PLAN and follow it!
Since this is a DAY TRADING FORMULA, we do not use EXPERTS, or hold onto any positions overnight! You will need to follow the PRICE IN REAL TIME.
THIS FORMULA IS NOT FOR EVERYONE! To hold on to any postions overnight, you should look into and follow a SWING TRADING FORMULA.
Again WELCOME!
PS We now have a wonderfull CHAT ROOM and a PLACE FOR ALL SERIOUS TRADERS OF THIS FORMULA! Here you can give us your feedback and ask questions? You need to download PALTALK at www.Paltalk.com and we are in the BUSINESS and FINANCE section under DAY TRADING and our ROOM IS "REAL STRATOBLASTER FORUM."
UPDATE TO THE BASIC RULES:
STEP ONE: Wait for PRICE during NEW TRADING DAY to go to GREEN ZONE OR RED ZONE FIRST AND VTOP OR VBOTTOM.
STEP TWO: WHICH EVER ZONE PRICE HITS FIRST AND GIVES US OUR REVERSAL SIGNAL WE TAKE THE TRADE: GREEN ZONE SHORT ON VTOP AND RED ZONE LONG ON VBOTTOM CANDLE WITH MORE JUICE THEN CANDLE BEFORE!
A: IF SHORT WE LOOK FOR 12 EMA TO EVENTUALLY CROSS DOWN BELOW 89 EMA TO CONFIRM OUR SELL SIGNAL. THE FURTHER 12 GOES BELOW 89 EMA USUALLY THE BETTER THE TRADE!We then look for Vbottom usually in opposite RED ZONE OR BEYOND for our Exit!
B: IF LONG WE LOOK FOR 12 EMA TO EVENTUALLY CROSS UP ABOVE 89 EMA TO CONFIRM OUR BUY SIGNAL. THE FURTHER 12 GOES ABOVE 89 USUALLY THE BETTER THE TRADE! We then look for the VTOP CANDLE TO FORM usually in GREEN ZONE OR BEYOND.
STEP THREE: We should be out of our TRADES NOW, IF EXITED on VBOTTOM SHORT OR VTOP LONG!!! IN ORDER TO TRADE FURTHER THAT DAY WE MUST HAVE STRONG JUICE AND CROSS OF 12 and 89 EMA FOR DIRECTION!!!
OPTIONAL TRADE FOR THE DAY!
We are now out of our original trade either short or long and exited as discussed. If our intial signal was a short trade and we exited at vbootm in RED ZONE, we could only trade LONG IF:
WE HAVE A CROSS OF 12 and 89 with big JUICE to take us NORTH, and:
WE COULD ONLY TRADE SHORT AGAIN IF 12 is BELOW 89 and we get strong JUICE and PRICE BREAKS THE VBOTTOM CANDLE, to take us SOUTH.
IF TRADING UK SESSION AND BIG NEWS COMES OUT IN US SESSION PLEASE MAKE SURE ALL TRADES ARE CLOSED BEFORE NEWS COMES OUT!
HERE IS THE UPDATED ZIP FILE FOR STRATOBLASTER INDICATORS!
HOPE THIS MAKES IT SIMPLE FOR EVERYONE AND CLARIFIES OUR SIGNALS!
http://strategybuilderfx.com/showthread.php?t=15865&highlight=%22Brain+Trading%22 |
| posted by Free Egold @ 9:13 AM |
|
|
|
| Thursday, May 18, 2006 |
| High Profit BrainTrader Strategy |
Here is my BT strategy. I've been using this strategy for about 6 months now and have been achieving very high results with it, aroung 40 to 100 pips a day. OK, here it is:
Timeframe: 1hour works best, but could use on 30 min.
Indicators:
Braintrend 1, Signal1, Stop1, and Stopline1, Signal Close Alert 1
t3 Aroon Horn Smoothed
t3 Aroon Horn Oscillator: line drawn at zero
Trend Trigger Modifed version 3 (changed parameters to 50 and -50, instead of 100 and -100)
Entry Long Signal:
1. Blue bar completed with Braintrend signal dot (alert will sound and tell you the entry with stop placement). Do not enter yet.
2. Aroon Horn Smoothed lines will cross each other. Do not enter yet.
3. Trend Trigger will cross above the +50 line (must be crossing or already above +50 line to signal safe entry). Do not enter yet.
4. We enter only when the Aroon Horn Oscillator crosses up over the zero line. (only if all of the other indicators agree)
Entry Short Signal:
Opposite above.
Waiting until the Aroon Horn Oscillator crosses the zero line will ensure that the trend is in strength. It also coordinates quite often with the minor retracement that happens after the initial price move. The Aroon Horn Smoothed indicator is an early signal but a retracement could happen that is why we wait for the Oscillator to signal.
I use to just jump right in when I first started using BT to try and get every pip but soon realized that there were many false signals given and one could have many whipsaws along the way. Using this strategy will eliminate many of those whipsaws and allow one to pull the trigger more confidently.
Important note on the Trend Trigger, there has been some discussion about it curve fitting past results to fit ideal parameters. That is why I say wait until the Aroon Horn Oscillator crosses zero to verify the established trend. The market is range bound when between the +50 and -50.
Note* One thing I've noticed, you can use the Trendsignal indicator (found elsewhere on this forum) as well to signal for entry but only if the other rules are followed.
I hope this helps some of you who are hesitant to pull that trigger when a trade happens. Please let me know what you think and if this can be improved. I've attached some of the required indicators (minus Braintrader) here. Enjoy.
Let's all share the knowledge
http://strategybuilderfx.com/showthread.php?t=14250&highlight=%22Brain+Trading%22
http://www.forex-tsd.com/brain-systems/494-brainsystem-trading-rules.html |
| posted by Free Egold @ 1:21 PM |
|
|
|
| Tuesday, May 16, 2006 |
| FOREX FOR DUMMIES by dude007(MMG) |
Hello Everyone
Its good to see so many people getting interested in trading Forex smile.gif . I've been into forex for the past 8 months. I see a lot of newbies trying to find Help. Well I've been there n ill tell u wot i did so it might help u guys. Ill be postin helpful info in this thread so keep ur eyes open. I spent 6 months Reading and learning everything I can from the internet without paying a Dime because I am a student at University lol. I finally opened a demo account 2 months ago and started practicing and testing out over 50 strategies. Trying to copy another persons strategy is not very rewarding because everyone's style of trading n strategies are different. So u need to develop your own style and strategy from all the strategies and indicators u learn to use.
Let me try n walk through wot u need to know.
FOREX has a HUGE amount of information to learn so u will never stop learning even if u trade for 50 years. So learn to accept this and remember the following:
!!!LEARN WOT U NEED TO MAKE MONEY AND LEAVE WOT U DONT NEED TO KNOW!!!
This is wot i did:
1. EDUCATE YOURSELF
Read and understand all the basic stuff on forex ie all the free materials from the internet and how some indicators work e.g. MACD, Bollinger Bands, Stochastic, RSI, Pivot Points etc. A really good and simple place to learn them free is: http://www.fxstreet.com/education/fxstrategy.asp
2. JOIN THE FORUMS AND MAKE A NETWRK OF TRADER FRIENDS
I cant stress the importance of joining Moneytec http://www.moneytec.com/index.php & http://www.elitetrader.com/. It will help u immensely and learn things in an hour which might normally take a week to learn. It has loads of strategies n advice from other traders. It is also a great place to make a network of trader friends to help u on the way smile.gif .
3. PRACTICE ON A FREE DEMO ACCOUNT - U know wot they say PRACTICE MAKES PERFECT.
I recommend u practice all the strategies n indicators on all the 6 major currency pairs. JUMP INTO THE DEEP END n practicing on a demo account its the best way to learn forex. Always keep your eyes open and observe carefully how all the indicators work. Also flip back n forth on the time charts 1min, 5min, 15min 30 mins 1 hr, 4hrs etc n look at the trends. The BEST trading platform that i found to trade on is Metatrader 3.0 or 4.0 http://www.metaquotes.net/metatrader
Oanda http://www.oanda.com/
4. CONTROL YOUR EMOTIONS, GREED AND DICIPLINE YOURSELF TO A CERTAIN STRATEGY TO WIN THE GAME OF FOREX.
Control your emotions and don't be Greedy because u will end up losing more. Its always good to take small bites at the apple instead of trying to Swallow the whole thing lol. Forex is not for everyone as u may know the famous figure of 90 to 95% fail. So if u try it out n think its not for u !!!LEAVE AT FIRST SITE!!!. From day one Practice n in your mind set a goal to develop your own style and strategy. From months of practice i have noticed i like short trades which lasts 10 - 30 mins per trade (sometimes up to an hour) on a 5 mins chart picking up 3 - 10 pips per tradesmile.gif. I am suited to this style and i have developed a strategy to go with it AND DECEPLINED MYSELF TO FOLLOWING IT.
*NEVER THINK U WILL FIND A STRATEGY THAT WORKS 100% OF THE TIME*
You WILL lose money in forex ladies n gents but U can win MORE time than u LOSE in forex that is the key to remember. Its possible to develop strategies that will win 90% of the trades u take and lose 10 % smile.gif . That's wot u have to aim for.... U will get there if u put in the hours and work SMART N HARD. It is really worth it at the end. Like all things "the first step is the hardest to take". When u know your stuff its simple.
5. HAVE A REALISTIC AIM
Before u start trading make sure u have a clear head otherwise u WILL LOSE. Aim for 10 to 15 pips of profit a day for starters. It's pretty simple to catch 10 - 15 pips per day if u know your stuff if u dont u WILL LOSE. when u'r fairly consistent at getting that aim for 20 - 30 pips this is possible when u get experienced and understand how different currencies behave n also develop ur senses for predicting accurately, u become a PRO at using a number of good indicators and DECEPLINE URESELF at using them. Occasionally u will catch 80 - 100 pips a day when u are at it so there is somthin good to look forward to rolleyes.gif.
Well thats how far i got up to folks with my trading. I hope it helps u guys. I have heard of people getting over 100 pips a day consistently n i think it is possible when u become a GURU in forex laugh.gif laugh.gif . I am not online as much as i like to because of my busy lifestyle but feel free to ask questions when iam online on MMG or post it here. So good luck n work ur way through smoothly "DONT LEARN TO RUN BEFORE U CAN WALK". and elite trader because it has tons of indicators, its pretty easy to learn compared to others, u can automate strategies n its free. is another very good one, its probably the easiest one to use but it doesn't have many indicators to use.
_________________________________________________________________________________
The most important technics u guys must learn to use in every trade are:
**PIVOT POINTS AND FIBONNACHI RETRACEMENT**
I have labelled on the chart so u know how they look like smile.gif . i cant stress enough how important they are because it is at those levels that the trend can change around most of the time. Think of them like walls where the ball can bounce of from. if u spend abit of time reading about them and then use them in every single trade u will soon master it. IT MIGHT LOOK COMPLICATED and annoying but its VERY IMPORTANT. If u learn them PROPERLY u can predict how the trend will develop for the day with a 70% accuracy. When u use this technic it better to trade on 1hr or maybe 15mins as well.
You can download a pivot daily indicator from Moneytec but u need to work out the fibbonnaci levels using the following calculator http://global-view.com/ssi/fibcalc.html by entering the previous days High and Low.
If its too confusing for the newbies study the PIVOT POINTS AND FIBONNACHI RETRACEMENT and then u will know wot iam gettin at.
__________________________________________________________________________________
*THE SECRECT TO USING INDICATORS*
Hello Everyone
I just wanted to mention something really important in order to trade well. Its just amazing how many things u learn on the way to being a better trader. Some people think its impossible to Win with Forex well that's true but its not impossible to WIN MORE TIME THAN U LOSE.
Everyone knows that emotions, patience, a good eye, practice, money management and a good system are vital in order to achieving this but yet a lot of people end up losing.
why IS THIS:
Well one common PROBLEM is that people keep changing there strategy when they lose 1 trade or another common problem is that MY INDICATORS WENT AGAINST ME OR IT GAVE ME A FAKE SIGNAL
Well I don't blame u cuz the same thing happened to me over thousand times
What's important is that u realize Y it went against u.
I will try and explain Y so it will help u to be better. Lighten.gif
Most of the indicators out there (around 99%) are all LAGGING Indicators which means they need past data in order to predict the future but we ALL know that markets don't always do what they did in the past so that's y they go against u at times.
Some of the most common lagging indicators are as follows:
MACD
MOVING AVERAGES
RSI
STOCHASTICS
ADX
WILLIAMR
CCI etc
Lagging indicators are good and u do need them at times but u need to use them in a package with some OTHER POWERFUL STUDIES in order to achieve that vital thing called CONSISTANCY.
The answer is u need the group of LEADING INDICATORS which can give u a good indication of points in the future where the market has a good chance of heading to and might retrace or have significant effects. Imagine the impact it will have on your trading if u can make high probable predictions on where the market is heading to before u place the trade. Believe me it will help alot. I suggest u use a mixture of lagging and leading indicators in your strategies to IMPROVE your chance of winning more trades.
Some examples of leading indicators are as follows:
FIBONACCHI
TRENDLINES
PIVOTS
ELLIOT WAVE
ANDREWS PITCHFORK
GANN etc
I suggest u do your research and develop an understanding on exactly how some of them work. They are more difficult to learn than lagging indicators but its well worth your time to learning them and develop strategies around them. Trendlines and pivots are the easiest ones to learn.
__________________________________________________________________________________
Guess wot i got some more goodies for u to improve ur trading. I have 2 exotic custom made indicators thts works excellently with the strategy that I recommended. These 2 indicators which I have attached below only work with metatrader 4 (that's y I've been nagging u guys to use metatrader 4).
The indicators are as follows
1. ERGOTIC - its very similar to MACD but is more sensitive n gives a clearer picture of trends. So remove MACD n put this one instead.
2. WILLIAMR36 -this is a new one tht Iam using n probably one of the best indicators tht I've come across with. Just place this on your chart n u will see 2 lines probably a green n red line. When both lines are at the centre u wait but when the green or red light starts moving apart u quickly check the other indicators for a trend change n make a trade. This indicator works wonderfully with the strategy which I recommended.
Study on williams % R here : http://www.trade10.com/williams.htm
Finally I got one more surprise for u guys. Remember I told u how important it is to use Fibonacchi Retracement with every trade. Well few of u asked me how it works so I found a nice ebook which explains HOW fibonacchi works. All I can say is READ n LEARN IT. Its nicely worded n only 22 pages. The website is currently allowing people to view the ebook for FREE .
Check it out at: http://www.fibonacciprofits.com/fb
Thats all for now but do post some some of ur trading results in this thread so it will give others n idea of how people are performing.
_________________________________________________________________________________
The main concept of my trading is:
1. I use daily, 4hr, 1hr and the 30min chart to get the big picture of wots going on.
2. Then i use fibonacchi n pivots on a 15min or 5 min chart as a guide ie u can also chk 1hr or 4hr charts as well.
3. Finally i place a trade when my indicators show me a GO signal.
__________________________________________________________________________________
These are the indicators iam using:
Bollinger Band (default setting)
EMA 10 & 50 (both short)
Kaufman 2 (default setting) - this is same as EMA but i use this as a trigger when it crosses EMA 10 wink.gif .
Daily Pivots (make sure u turn the Camarilla to TRUE in the properties of the indicator) .
Stochastic (Default setting)
William 36 (Default Setting)
Ergodic (Default Setting)
ADX (default setting)
Denapoli MACD Histogram (default setting) - this is a new one i picked up n is very similiar to ergodic but better than the normal MACD. The reason i use this is to remove whipsaws and get a clear picture of wots going on. However ergodi allows me to view the trend closer. U can use either this or ergodic but i prefer both to be there smile.gif .
Finally and most importantly place FIBONACCHI RETRACEMENT for the day on the chart smile.gif .
I know iam using tooo many indicators but they all help me n u need to practice looking at all of them within 20 sec before a trade n make a judgement.
This is wot u do
1. Look at the 4hr, 1hr, 30 min and 15 mins charts to check the big picture of wot exactly is happening for the day.
2. Check between which Fibonacchi retracement level the trend is currently at e.g. 61.8 to 100. Then look at where all the pivot points are between the fib levels.
3. Goto 5 mins or 1 min chart n check where the 50 EMA is. If its below the currency trend its a BUY signal if its above the currency trend its a Sell signal. Also check the trend in relation to Bollinger band as well. Once thats confirmed u need to look at 10 EMA and Kaufman 2 for a cross to occur in the direction of the trend.
4. As soon as the cross is about to occur u need to look at Stochastic, adx, Denapoli MACD Histogram to see if they are in the correct postion n the trend that is developing will be a genuine one ie not a whipsaw or a fake signal.
5. The u quickly look at william 36 and ergodic to see if they have both changed directions if they have then GET READY TO PLACE A TRADE. As soon as William 36 and ergodic cross the trend will accelerate n make u big money lol.
PLEASE BEAWARE THT WHEN THE CURRENCY TREND GOES BELOW 0 OR ABOVE 100 IN THE FIBONACHI LEVELS U NEED TO BE CAREFUL N BETTER NOT TO PLACE NEW TRADES.
__________________________________________________________________________________
Well iam using the same strategy as the one i listed in detail on above post. Its just a strategy that i have made up myself using all the stratagies that i have read and practiced to suit my trading style. Since then i managed to fine tune the strategy furthermore after following it in a decepline manner. I just cant beleive the way its working.
I USE METATRADER QUOTES AND PLACE TRADES ON FXCM
These are the indicators iam using:
-----------------------------------------------------------
Bollinger Band (default setting)
EMA 50 (short)
Daily Pivots (make sure u turn the Camarilla to TRUE in the properties of the indicator) .
Stochastic (Default setting)
William 36 (Default Setting)
Denapoli MACD Histogram (default setting) - This is my magic pill indicator smile.gif which is a fine tuned Macd . The reason i use this is to remove whipsaws and get a clear picture of wots going on.
Finally place FIBONACCHI RETRACEMENT for the day on the chart.
-----------------------------------------------------------
Well i managed to remve a few of the indicators from my previous post.
This is wot i do
1. Look at the daily, 4hr, 1hr, 30 min and 15 mins charts to check the big picture of wot exactly is happening for the day. Also look at the 50 ema on the charts and check wether its below the currency trendline (bullish BUY movement) or above the currecny trendline (bearish SELL movement) on the 1 HOUR CHART N THE 30 MINS CHART.
2. Check between which Fibonacchi retracement level the trend is currently at e.g. 61.8 to 100. Then look at where all the pivot points are between the fib levels.
4. THIS IS THE IMPORTANT BIT - say for example the 50 EMA is below the currecny trendline on both 1 hour chart and 30 mins chart which indicates the market is goin up (bullish). Now check the Denapoli MACD Histogram ON 30 MIN AND 1 HOUR CHARTS and see it it also indicates a upward bullish trend forming if so then jump to the 1 minute chart.
5. Then u quickly look at the 1 minute chart and see where exactly the currency trandline is between the FIBONNACHI RETRACEMENT LEVEL N PIVOT POINTS. if there a gap of about 10 pips or more towards the next pivot point or fib point UP (bullish movement) then u can place a trade dance9bh.gif smile.gif. if they are not u can use the stochastic and the william36 to see wots happening on the 1 min chart and wait for it to occur.
6. So remember the whole point of the gamu is u trade ONLY BETWEEN PIVOT POINTS AND FIB LEVELS if there is a 10 Pip or more gap in the direction of what the 30 minute and the 1 hour chart is showing u in regards to EMA 50 AND MOST IMPORTANTLY THE Denapoli MACD Histogram smile.gif . ALWAYS PLACE UR TRADE ON THE 1 MINUTE OR 5 MINUTE CHART.
U can catch between 5 - 20 pips per trade with this strategy. Each trade takes me on avarage about 40 mins.
I've been using this strategy since 14th April and has been over 90% consistant.
PLEASE NOTE : DONT AIM TO CATCH TOO MANY PIPS IN ONE GO. Just get in and get out ASAP. Also set limits to your profits at the next pivot or fib level (which u keep the 10 pip gap for) from and a stop loss at about 30 pips. This strategy works very well on GBPUSD. I have recently strateg using them on other pairs with very good results as well smile.gif .
I have posted my trading results below since i started trading demo with fxcm on 9th of april which has over 50 trades smile.gif . Just look at the results from 14th april when i put this baby on.
______________________________________________________________________________ |
| posted by Free Egold @ 11:08 AM |
|
|
|
| Thursday, May 11, 2006 |
| Hedge Hog - Daily Strategy |
Hedge Hog Strategy
STRATEGY OVERVIEW:
Each day Monday-Friday at 00:00 GMT since market is closed), you enter a BUY and SELL for the EUR/USD pair (some systems require you to HEDGE in order for the opposite order not to be closed) with a LIMIT (TAKE PROFIT) of 14 pips. Most days this will give you 28 pips profit.
Other pairs besides the EUR/USD have been looked at but not studied in depth to determine if they are suitable.
HISTORICAL BASIS FOR STRATEGY:
After reviewing historical data from GMT (nothing done on Saturday/Sunday at 6/23/89 to 2/13/06 (over 15 years) I have observed the following:
With a LIMIT (TAKE PROFIT) of 9 pips:
BUY orders were successful 89.1% of the time (3855 out of 4326 closed in profit)
SELL orders were successful 91.1% of the time (3944 out of 4326 closed in profit)
In both BUY and SELL orders there was less than 1% risk of neither being closed on a given day.
With a LIMIT (TAKE PROFIT) of 14 pips:
BUY orders were successful 83.5% of the time (3613 out of 4326 closed in profit)
SELL orders were successful 85.7% of the time (3707 out of 4326 closed in profit)
In both BUY and SELL orders there was less than 1.5% risk of neither being closed on a given day.
With a LIMIT (TAKE PROFIT) of 19 pips:
BUY orders were successful 77.4% of the time (3350 out of 4326 closed in profit)
SELL orders were successful 79.3% of the time (3430 out of 4326 closed in profit)
In both BUY and SELL orders there was less than 2.5% risk of neither being closed on a given day.
Orders NOT Closed
About 80% of the orders placed will be closed in PROFIT each day but there are days when either the BUY or SELL (and rarely both) are not closed. What do you do?
95% of the orders not closed will be closed within 1-3 days (usually the next day). If an order is not closed within 48hrs of being opened, MANUALLY CLOSE the order and DOUBLE the number of lots for the new orders the day just beginning (for which ever direction was not successful (BUY or SELL). NOTE: Orders that were not successful for 3 days in a row only occurred 15 times in the time period studied (less then 3/10 of a percent).
SUMMARY
Each day at 00:00 GMT (Monday-Friday) place a BUY and SELL order (or HEDGE) for the desired pair (EUR/USD) with a LIMIT of 14 pips.
If after 48hrs an order has NOT CLOSED then manually close and place your order for the new day for double the lots (BUY or SELL). Only double the order that was not successful (i.e. if it was a BUY that you manually closed then double the lots but place your SELL for the new day as you normally would). |
| posted by Free Egold @ 11:15 AM |
|
|
|
| Wednesday, May 10, 2006 |
| Nina's CatFx50 |
Here you are with the easiest system of the FOREX world.
Plot an EMA50 on majors. Time Frame 30.
We play the cross here. You buy when price crosses EMA50 and next bar opens above it. And the opposite for sell.
Can you tell me how many pips could you have made today on cable?
And yesterday?
And on Monday?
Great, isn't it.
You only need an EMA, a single, naked EMA.
Are there false signals? Yes, mates. There are. But, if you are not greedy and avoid news time, you make more wins than loses.
Today cable was a sell at 1.7384 and it has made a low at 1.7290.
CHF was a buy at 1.3076. It has made a high at 1.3159.
EUR was a sell at 1.1772. It has made a low at 1.1703.
Could we avoid false signals? Yes, we can or reduce them at minimum.
Enjoy!!
To be continued
Nina
UPDATE 16-03-06:
RECAP of CatFX50:
Plot Hist_Step_MA_Stoch_KV1_Ex_02 set at 2000 bars.
Set filters on Step: +0,04 and -0,04.
Plot Inverseind with EMA50 (optional).
Plot EMA50 on chart.
TF: 30 minutes.
Trade time: 08:00cet to 18:00cet
Standard or Level 1 signals:
Buy when price crosses EMA 50 and new bar opens above. StepMA_Stoch must be green.
Sell when price crosses EMA 50 and new bar opens below. StepMA_Stoch must be red.
If price and StepMA_Stoch crosses are simultaneous, the better.
Level 2 signals (riskier):
For instance, when price is above EMA 50 with StepMA_Stoch in green. Price then opens one bar at least below EMA 50 and StepMA_Stoch keeps in green mode. When price opens again above EMA 50 with StepMA_Stoch validating (green), we can buy. The opposite for a sell.
Level 3 signals (riskier):
For instance, we are in bullish mode: price above EMA 50 and StepMA_Stoch in green. Suddenly, price goes down crossing or without crossing EMA 50 and obviously without opening below it. StepMA_Stoch changes to red. We buy when price goes up again always validated by StepMA_Stoch that should change to green again.
Something to take into account:
Pairs to trade: EURUSD, USDCHF and GBPUSD.
When bar opens more than 20 pips above/below EMA 50, the signal is riskier.
Plot FiboPivots and Camarilla L3 - L4 and H3 - H4.
Do not buy/sell, for instance, EURUSD because GBPUSD has a signal. Wait for the signal to come in each pair you want to trade.
FOCUS, PATIENCE AND DISCIPLINE.
Level illustrated: |
| posted by Free Egold @ 8:42 PM |
|
|
|
|
| Another Trade system |
http://www.tradecurrency.ca/daytrade.htm
Description: An intraday trend following trading method, using the following indicators:
5 period WMA
10 period SMA
Slow Stochastic (5,3,3)
RSI (14)
MACD (default)
Rules: Add the above indicators to your 10 minute chart. Only take trades between 8AM-12PM EST and/or 2AM-4AM EST.
BUY the exchange rate when the 5 WMA crosses up past the 10 SMA and the Stochastic is signalling up, RSI > 50 and the MACD histogram >0 and MACD averages crossed up.
SELL the exchange rate when the 5 WMA crosses down past the 10 SMA and the Stochastic is signalling down, RSI<50
http://www.dailyfx.com/FinanceChart.html?symbol=EUR/USD
Not now,but later, at 2 pm EST (new york time) the forex will be open again.
But not trade with real money, cause 2pm est is too ,see the rules above,but u can test if the indicators works. |
| posted by Free Egold @ 8:40 PM |
|
|
|
|
| GBP/USD- "Set and Forget it" Trades. by Big Pippin |
Hello everyone!
I am trying something new. For those of you who have followed my other blog at http://pippinainteasy.blogspot.com , this is another one that I'm trying out. This time it's more of a "set and forget" type deal so that hopefully, the people who can't day-trade can benefit from this. I will not be posting system specifics, but I will simply be giving out buy and sell recommendations, along with stops and targets. Here are some notes you should read before trading these signals:
1) Disclaimer: Remember, only you control your own money. These are simply recommendations that I, myself, am trading and am not guaranteeing that you will make money off of these signals. Trade at your own risk!
2) All trades are taken on the GBP/USD, 10 minute charts. I use FXCM as my broker.
3) All signals will be posted around 8:00 am EST.
4) Close all your trades at the close of the 2:00 pm EST candle.
5) If the first trade triggers but then loses, you can still leave your other order open until 12:00 pm EST. If your 2nd trade is not triggered by 12:00 pm EST, then cancel the order.
6) If the first trade triggers but then loses, you can reset that same entry order for a re-entry. If the re-entry doesn't happen by 12:00 pm, then cancel that order.
7) If neither of the trades trigger by 12:00 pm or if you still have an entry order in place that hasn't been triggered, cancel all orders.
8) When midpoint is hit, move stop to breakeven.
9) On news days (I will notify which days are news days) do not place your orders until 8:40 am EST. If the price is out of the range, wait for price to close back within the range (I use 10 minute charts) before placing the orders. If price doesn't fall back within the range, simply stay out of the market.
*************************************************
New Rules (beta):
1) Disclaimer: Remember, only you control your own money. These are simply recommendations that I, myself, am trading and am not guaranteeing that you will make money off of these signals. Trade at your own risk!
2) Trade 2 lots for each trade.
3) All trades are taken on the GBP/USD, 10 minute chart. I use FXCM as my broker.
4) All signals will be posted around 8:00 am EST.
5) Close all your trades at the close of the 2:00 pm EST candle.
6) If the first trade triggers but then loses, you can still leave your other order open until 12:00 pm EST. If your 2nd trade is not triggered by 12:00 pm EST, then cancel the order.
7) If the first trade triggers but then loses, you can reset that same entry order for a re-entry. If the re-entry doesn't happen by 12:00 pm, then cancel that order.
8) If neither of the trades trigger by 12:00 pm or if you still have an entry order in place that hasn't been triggered, cancel all orders.
9) When midpoint is hit, close out 1 lot and move the 2nd lot's stop to breakeven.
10) On news days (I will notify which days are news days) do not place your orders until 8:40 am EST. If the price is out of the range, wait for price to close back within the range (I use 10 minute charts) before placing the orders. If price doesn't fall back within the range, simply stay out of the market.
I think that's it for now. I will be updating this post whenever I feel necessary so be sure to check it every now and then. It will be the first link at the top of page. If you'd like to see the trade record since the blog was started click here.
Cheers and happy trading!
-BP
http://www.moneytec.com/forums/f59/gbp-usd-set-forget-trades-18745/? |
| posted by Free Egold @ 8:37 PM |
|
|
|
|
| Trading Eur/Usd with uncle Elliot |
I am going to start a new thread with my simple Elliot Wave trading system.
I am doing this so as not to clog up other threads and also as a personal diary where I can keep track of my charts, analysis and trades as I go. EW trading incorporates many other TA techniques such as trend lines, s+r levels, fib. levels, divergence etc etc. When trading EW, what I am looking for are the major waves, to trade these and to get about 50% of these moves (anywhere between 50-150 pips). As the thread progresses I will add my thoughts and the way I trade the waves so lets me begin.
PS: I am by no means an expert in EW's and am learning as I go, I have been doing this for 6 months and know that I have lots more to learn and that this thread would be a good way to continue advancing. Also my notation is not to EW standards and I hope to improve this as I go.
Entry#1 4Hr chart
End of european trading July 6.
Euro is in minute wave iv up of the larger 3 down. The previous wave iii bottom was at 1.1867 and wave iv has now corrected to 1951 but not cofirming this as the top yet a break below 1.1890 would confirm this wave iv and the start of wave v down to a target of 1.1830. Wave 4's are messy affairs at times and trade these only if you are a good scalper. Levels to watch are 1.1955 and 1.1900. In between here for scalpers only. Long above close of 1.1980 and short on close below 1.1890.
See Daily chart below and 4 hr chart in the next entry
http://www.moneytec.com/forums/f59/trading-eur-usd-uncle-elliot-15582/? |
| posted by Free Egold @ 7:57 PM |
|
|
|
| Friday, April 07, 2006 |
| Teknik Exiting |
I hope this will help. I took notes when I studying catfx50. When I saw one post his thought about exit strategy I will record it on my note. Here it the result .
Exit:
We have a nice system but we shouldn't trade it blindly. Never!!
scale lots and switch to TF5.
CatFx50 makes money 98% of the time. It is free. You have a powerful entry. You only need a EMA and an indicator (a filter) to validate the cross. That's all you need. Now we are tweaking the exit. We'll make it. Sure
1.StepSto_v1 (5,5,3) (---when corossing each other, exit)is the best I've seen so far for exits along with Stochastic. We should keep searching
2.StepMA Stoch setting:
PeriodWATR 10
Kwatr 1.1
HighLow 1
3.Use WCCI 13 cross back at +100/-100 for exit...///Add CCI turbo 6 or 14 and level +100/-100 and you can use it for razor sharp exit...
4.Parabolic Sar set at 0.02 and 0.2 could be another way.
5.HMA 21 3 0
When the color change exit!
HMMA is more than enough to find the good entry and exit points after a considerable amount of screen time
6.Plot 50EMA on Inverseind. Nice and earlier signals.
7.Hi all,
First off, I don't know if I've said thank you to Nina yet for posting this method, so Thank You.
Second, I'd like to suggest using StepMA v6.2 with a Length setting of 100 (everything else default) for the exit. After looking at the code, I still don't really understand how it works, but in many of the trend-following systems that I'm testing/developing, this indicator has really helped with exits. Basically, once in a trade, stay with the trade until the step turns against you on the Close of the bar. If the step goes flat, you stay in the trade.
This thing does a really good job of keeping you in the trade for the big moves and not letting you get stopped out due to a small retraction in price. Of course, this will never get you out at the very top or bottom of the move, and sometimes you may give some profits back, but the abililty to stay in the bigs moves more than makes up for that (IMHO).
8:I used this indicator for exit. MaksiGen_Range_Move.mq4
I exit for USDCHF with the price 1.2738 or 1.2739. It is almost the same with Nina. If the price touchs the resistance line of this indicator I exit. It is Low (if you click on the bar you will see Price open, close, low etc). It is the same with any EA: price is touching or crossing some line (resistance line or the profit level line) and order is closed.
Problem is that these support and resistance lines from this indicator are the dynamic lines. It means these lines are moving sometimes.
How to use this indicator:
When you attach this indicator to the chart you will see two high lines and two low lines. And the trend lines. And sometimes you may see the level of buy stop or sell stop orders (you may place this orders if the price will break all the S&R lines). These high/low lines are the support and resistance (S&R) lines. The price may stop near these lines for simetime, or to break the lines out.
Some people are using this indicator to trade when the price is breaking these lines (first resistance line or second one) following the indicator's instruction for buy or sell orders (you may see it from the image attached).
The other people are trading following the trend line and support and resistance lines to manage the orders and for exit (for the orders which are already opened).
If we opened the order we may use this indicator just to inderstand when to exit (and why). Usually people are using this indicator on M30 and M5 timeframe in the same time.
These lines are the dynamic lines. They are changing but if you can see from the image nothing was changed during the several hours already. On M30 timeframe the lines are changing if all the situation is changing (one or several times per day may be).
Together with this indicator are am using static support and resistance lines from the indicator attached.
http://www.forex-tsd.com/attachments...f?d=1137589221
9.http://akuma99.blogspot.com/2005/11/theory-when-to-exit.html
10.http://www.investopedia.com/articles/trading/04/092904.asp
11.http://www.forex-tsd.com/indicators-metatrader-4/932-devdestination.html
12.I sell the first lot at the 38 Level, the second lot at the 55 level and the third if i get it at 89 level. In the evening i take what the market gives me if i still have positions
http://www.forex-tsd.com/attachments...g?d=1139334355
13.
After following and re-reading this thread for some time I am amazed by how much input there has been to constantly analyse, test and improve something soooooooooo simple......that merely started with a bare naked 50ema....like you say!!!
Yet you constantly stay open and encourage new ideas....so here's another one!! (btw How's CatFx16 coming along?)
I would like your thoughts on this simple idea:
You said "you typically go to a 5min chart" to "fine tune" your exits manually off of supports and resistence and fibs and pivots....don't most discretionary traders do this?
To help our exits, I suggest we employ a 5min chart running in the background with the following alert set up as the assistant to our CatFx50 30min charts.
The Simple 5min alert:
Stochastic 5;3;3 5min tf
We know, the standard Slow Stochastic is plotted as two lines called %K, a fast line and %D, a slow line.
" %K line is more sensitive than %D
" %D line is a moving average of %K.
and that the 80% value is commonly used as an overbought warning signal, and the 20% is used as an oversold warning signal.
BUT......I am finding the signals become even MORE reliable if you WAIT.
Try this: (demo of course!)
on an uptrend, enter the exit (or a reversal!), when the fast, %K line, is >95% AS LONG AS the slow, % D line, is <90%. ( if %D is above 90% it indicates considerable strength may remain in continued direction).
on a downtrend, enter the exit (or a reversal!), when the fast, %K line, is <5% AS LONG AS the slow, %D line, is >10%...(same logic regarding remaining strength.)
OF COURSE..........EVERYONE use all other discretions/rules regarding support and resistance, daily trend, trading times, news events, candle formation etc. for exiting the trades (this use of the stochastic is meant to be HELPFUL to the "ART" of exiting NOT a mechanical answer to prayer!!
If this is helpful to our exits, we would simply need an alert signal for the slow stochastic indicator that is structured for the above.
It would simply trigger on the fast %K line equal to or greater than 95% and below 5% and run in the background while we moniter our 30 min charts!
If this is a bad idea then please just throw it out....and we will keep moving on polishing this "holy grail"
14。I try found exit for CatFX50, setting MACD 45,144,9 (someone post this setting by picture here) level 0.0015 and -0.0015, RSI 14 combine with StepMA only Blue line
for reading if CatFX50 give signal up then create some point and after that RSI 14 move below blue line and MACD signal (green line) still hold below 0.0015 it's good point to exit see pic1
for opposite see pic2
if price want more pips up we jump again when RSI cross again blue line and MACD signal move above 0.0015 level for confirm (see pic3) and exit when yellow line cross blue line and MACD signal downtrend (see pic4) but by this entry we not at the first boat and usually we missing great pips and need another filter for collecting every pips
15.read all the pages and i have almost all indicators but i miss only one and i cant find it now :Stepma stoch ...i have StepMa_stoch but as i could see from one post they are not the same.Can someone please post it again please.
As for exit i agree to take 15 or 20 pips as this is crazy market and let other part run.Try to use Supertrend indicator for exit.
This system is very good,i used before entry when MA5 crosses MA34 but with no filter (my cousin who teached me trading did not tell me about filters
so i lost almost my whole account later...mostly due to lack of confidance after big loses) and those 2 systems lookes almost the same.MA5 with MA34 is old system and many traders out there use it with success.
Bunny system is simular,WMA5 with WMA20 with 25-30 pips filter but i found NIna's is best for now due to indicators maded and it is fast (no lag) almost like you look at price action.
I hope one day we will made our brokers to forward our trades and not to take other side so with plenty of Nina folowers (all trend folowers) we could move he market like in old days...few years ago when forex was a lot easier.
Keep up good work;i am sorry that i can't take a part in programming mql4 (i am educated programmer) because i am tired right now from learning new languages and mql4 does not look to easy (i learned CTL(GFT platform),easylanguage for prorealtime,tradestation...) but it would be grait if someone could make EA with this system with variable exit strategies. |
| posted by Free Egold @ 4:41 PM |
|
|
|
|

